2 Data
The research presented in this book relies on two primary sources of data:
Recorded Catch (RC): This dataset comprises detailed records of fishing trips that were documented by data collectors in the coastal municipalities of East Timor starting from January 2018.
Estimated Catch (EC): This dataset provides a broader view of catch data on a regional level. It is created by combining RC with additional information, including the frequency of fishing trips made by each fishing boat and the total number of boats surveyed (censused) in each municipality. This combination extrapolates the recorded catch data to a larger scale.
2.1 Catch weight and nutrional content
The total estimated catch weight is determined by the number of individuals and the length range of each catch. Specifically, during the initial phase of the Peskas project (July 2017 - April 2019), the standard length measurement used was the fork length (FL), which later changed to the total length (TL) in the subsequent and current version of the project. We utilized the API service offered by the FishBase database to incorporate length-to-length and length-to-weight conversion tables, using information from survey landings to calculate the weight in grams based on the following formula:
W = a × L^b
Here, W represents the weight in grams, L is the total length (TL) in centimeters, and a and b are the conversion parameters obtained from FishBase for each fish species.
The FishBase database provides length-to-length and length-to-weight relationships for over 5,000 fish species. Typically, there are multiple records for the parameters a and b for each species. Since the length measurements in Peskas’ first version pertained to FL, we initially standardized all length measurements to TL using the FishBase length-to-length conversion tables. Subsequently, we applied the TL-to-weight conversion tables to estimate the weights.
The FishBase length-to-weight conversion tables offer species-level taxonomic resolution. To derive a singular length-to-weight relationship for each fish group, we calculated the median values of parameters a and b for all species within a particular fish group. To ensure relevance to the region of interest, we refined the species list using FAO country codes (https://www.fao.org/countryprofiles/iso3list/en/) pertinent to Timor-Leste and Indonesia (country codes 626 and 360, respectively). For instance, to ascertain the weight of a catch categorized under the fish group labeled ECN (representing the Echeneidae family), we first identified the species within ECN documented in Timor-Leste and Indonesia. After this, we computed the average values of the parameters a and b for the identified species, which in this case were Echeneis naucrates and Remora remora (as illustrated in the figure below).
To address the scarcity of measured nutrient values for fish, which are typically limited to a few species and countries. To overcome this data limitation, MacNeil et al. developed a Bayesian hierarchical model that leverages both phylogenetic information and trait-based information to predict concentrations of seven essential nutrients: calcium, iron, omega-3 fatty acids, protein, selenium, vitamin A, and zinc for both marine and inland fish species globally (see Hicks et al. 2019). For each catch, the nutritional yield was calculated by combining the validated weight estimates for each fish group with the modelled nutrient concentrations. Specifically, we used the highest posterior predictive density values for each of the seven nutrients, which can be found in the repository (https://github.com/mamacneil/NutrientFishbase). For non-fish groups—including octopuses, squids, cockles, shrimps, crabs, and lobsters—nutritional yield information was not available in the NutrientFishbase repository models. We retrieved the necessary data for these groups from the Global food composition database, using the same methodological approach as for the fish groups to estimate their nutritional content. To represent the nutrient concentration associated with each fish group, we used the median value as a summarizing metric.
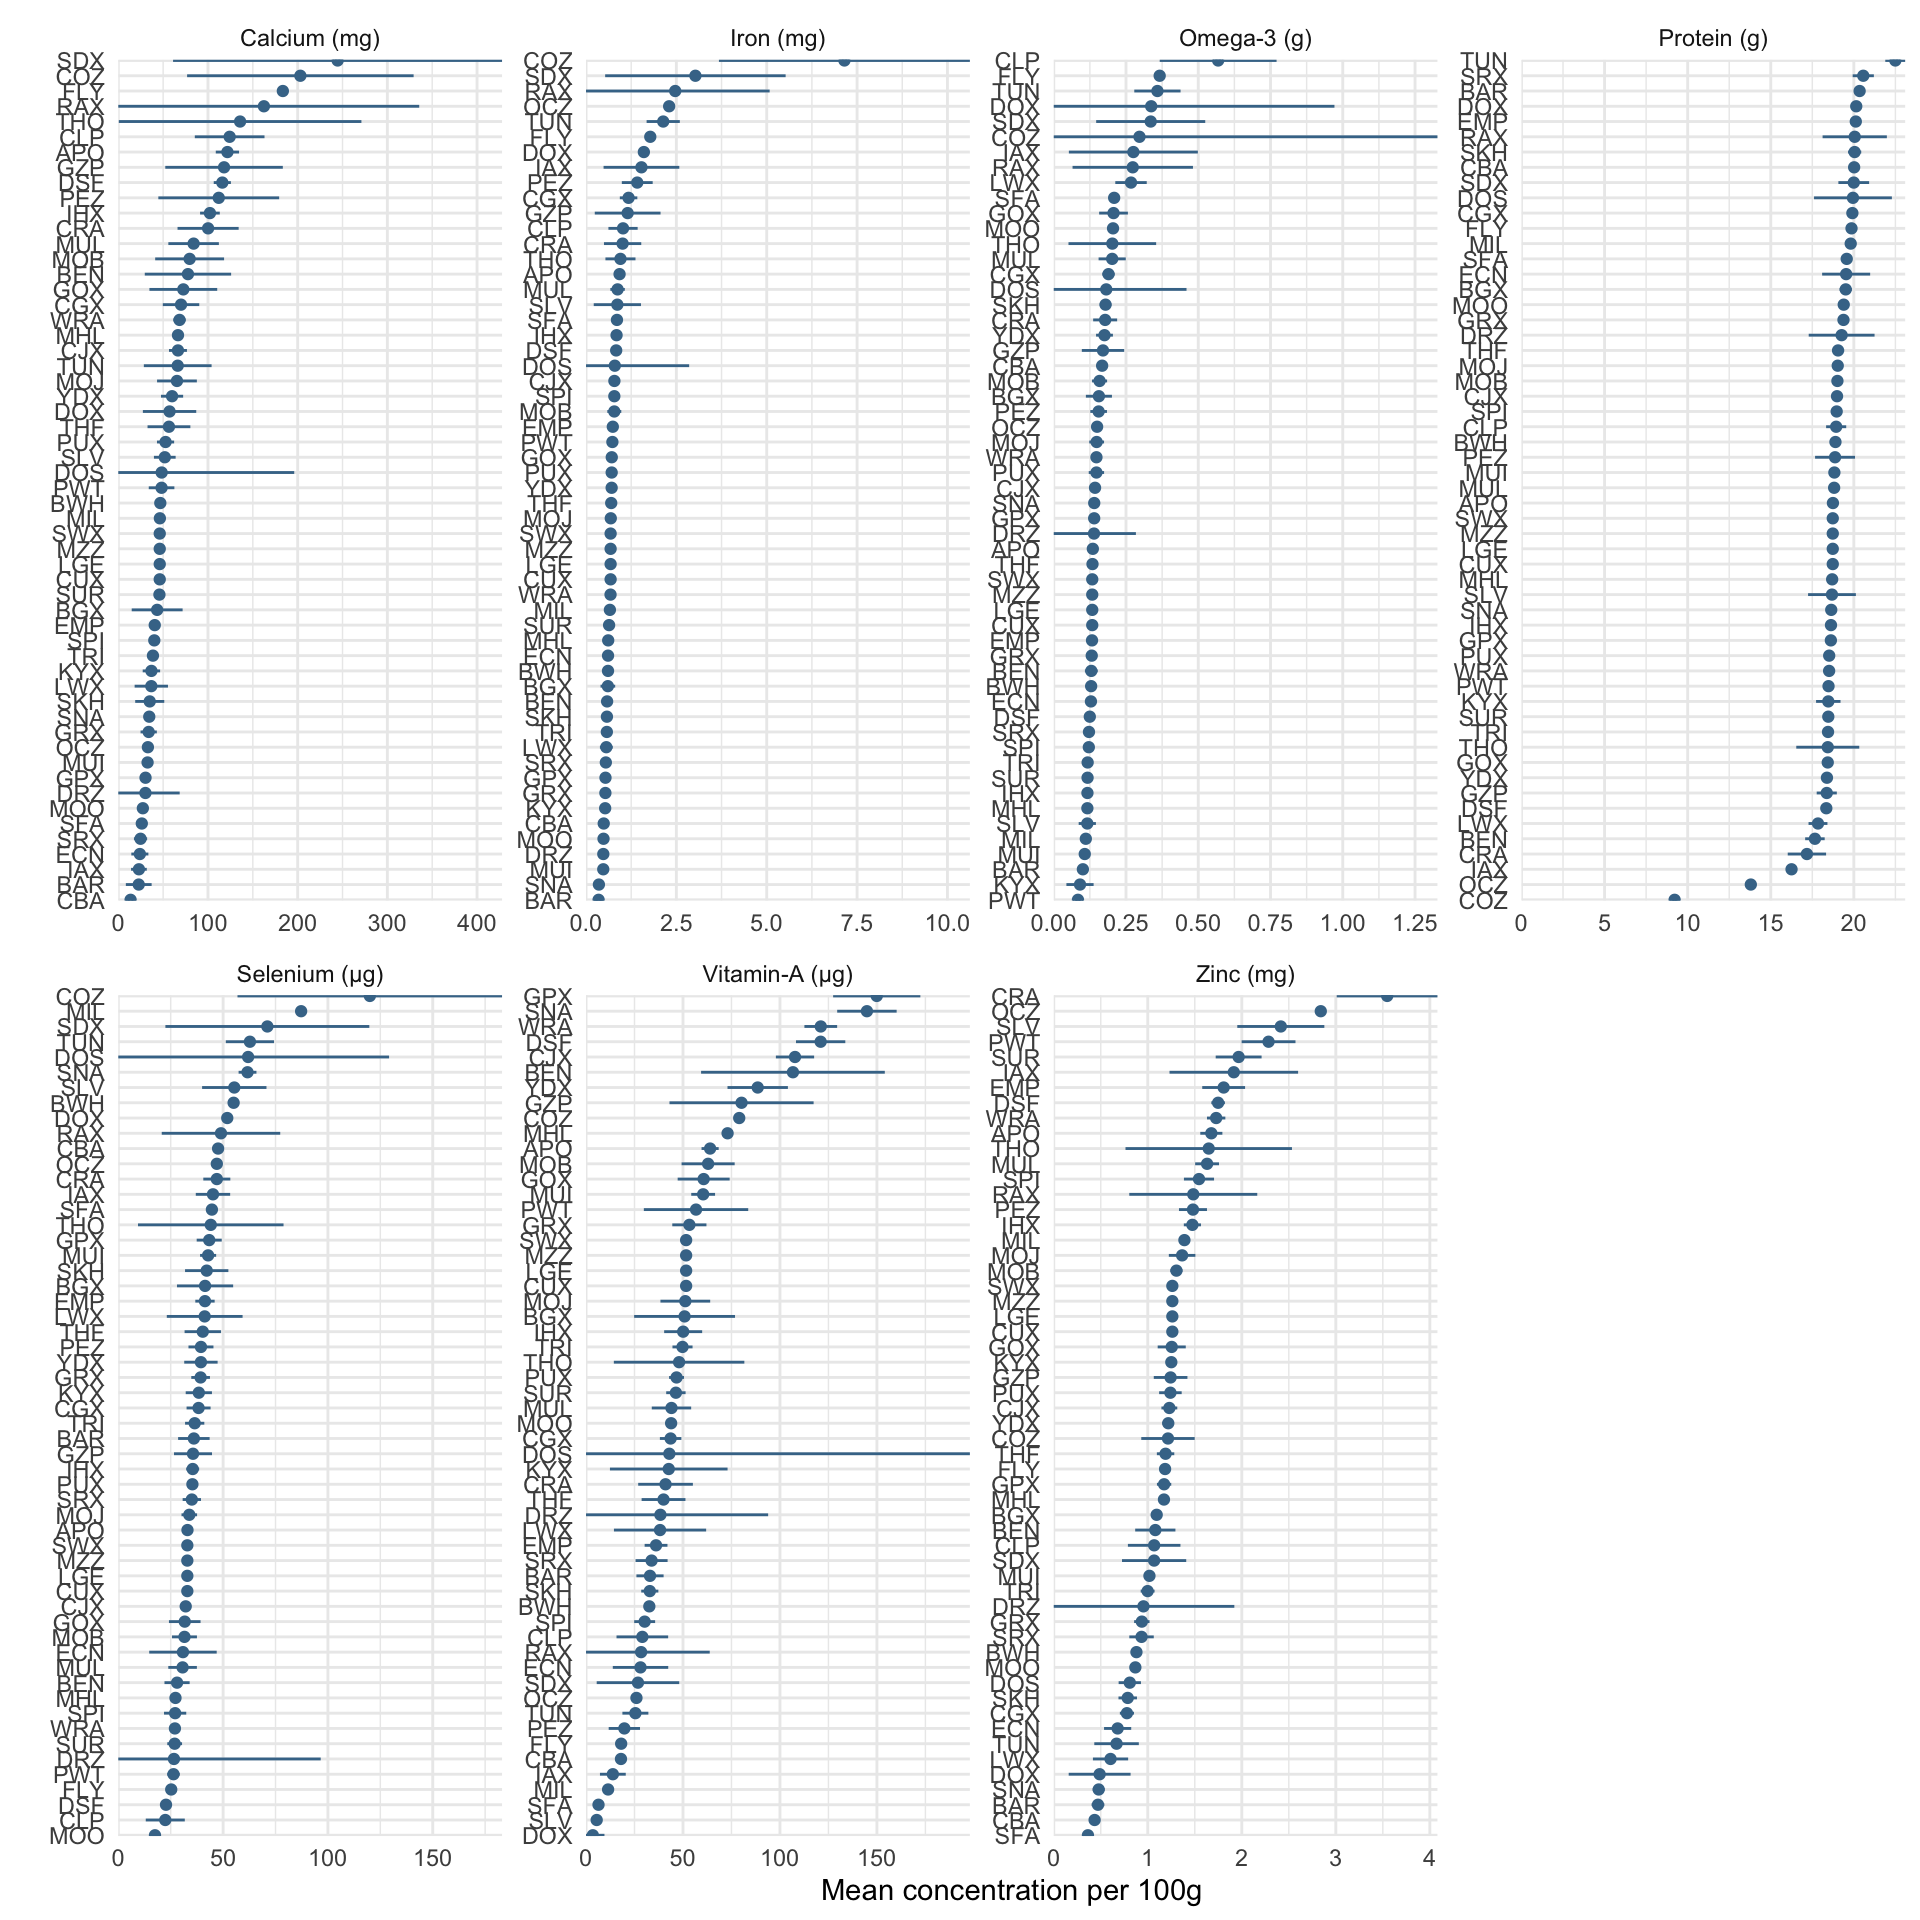
Figure 2.1: Distribution of nutrients’ concentration for each fish group. Dots represent the median, bars represent the 95% confidence interval.