bonds <- sf::st_as_sf(timor.nutrients::timor_bonds)
tot_prod <-
timor.nutrients::map_data |>
dplyr::rename(region = area) |>
dplyr::rename(annual_catch_tot = annual_catch) |>
dplyr::rename(WRA_tot = WRA) |>
dplyr::mutate(region = ifelse(region == "Liquiça", "Liquica", region))
region_nutr <-
timor.nutrients::map_data_adj %>%
dplyr::rename(region = area) %>%
dplyr::filter(!region == "National") %>%
dplyr::mutate(region = ifelse(region == "Liquiça", "Liquica", region)) %>%
dplyr::right_join(bonds, by = c("region")) |>
dplyr::left_join(tot_prod, by = "region") |>
dplyr::select(region,
annual_catch_tot,
WRA,
geometry)
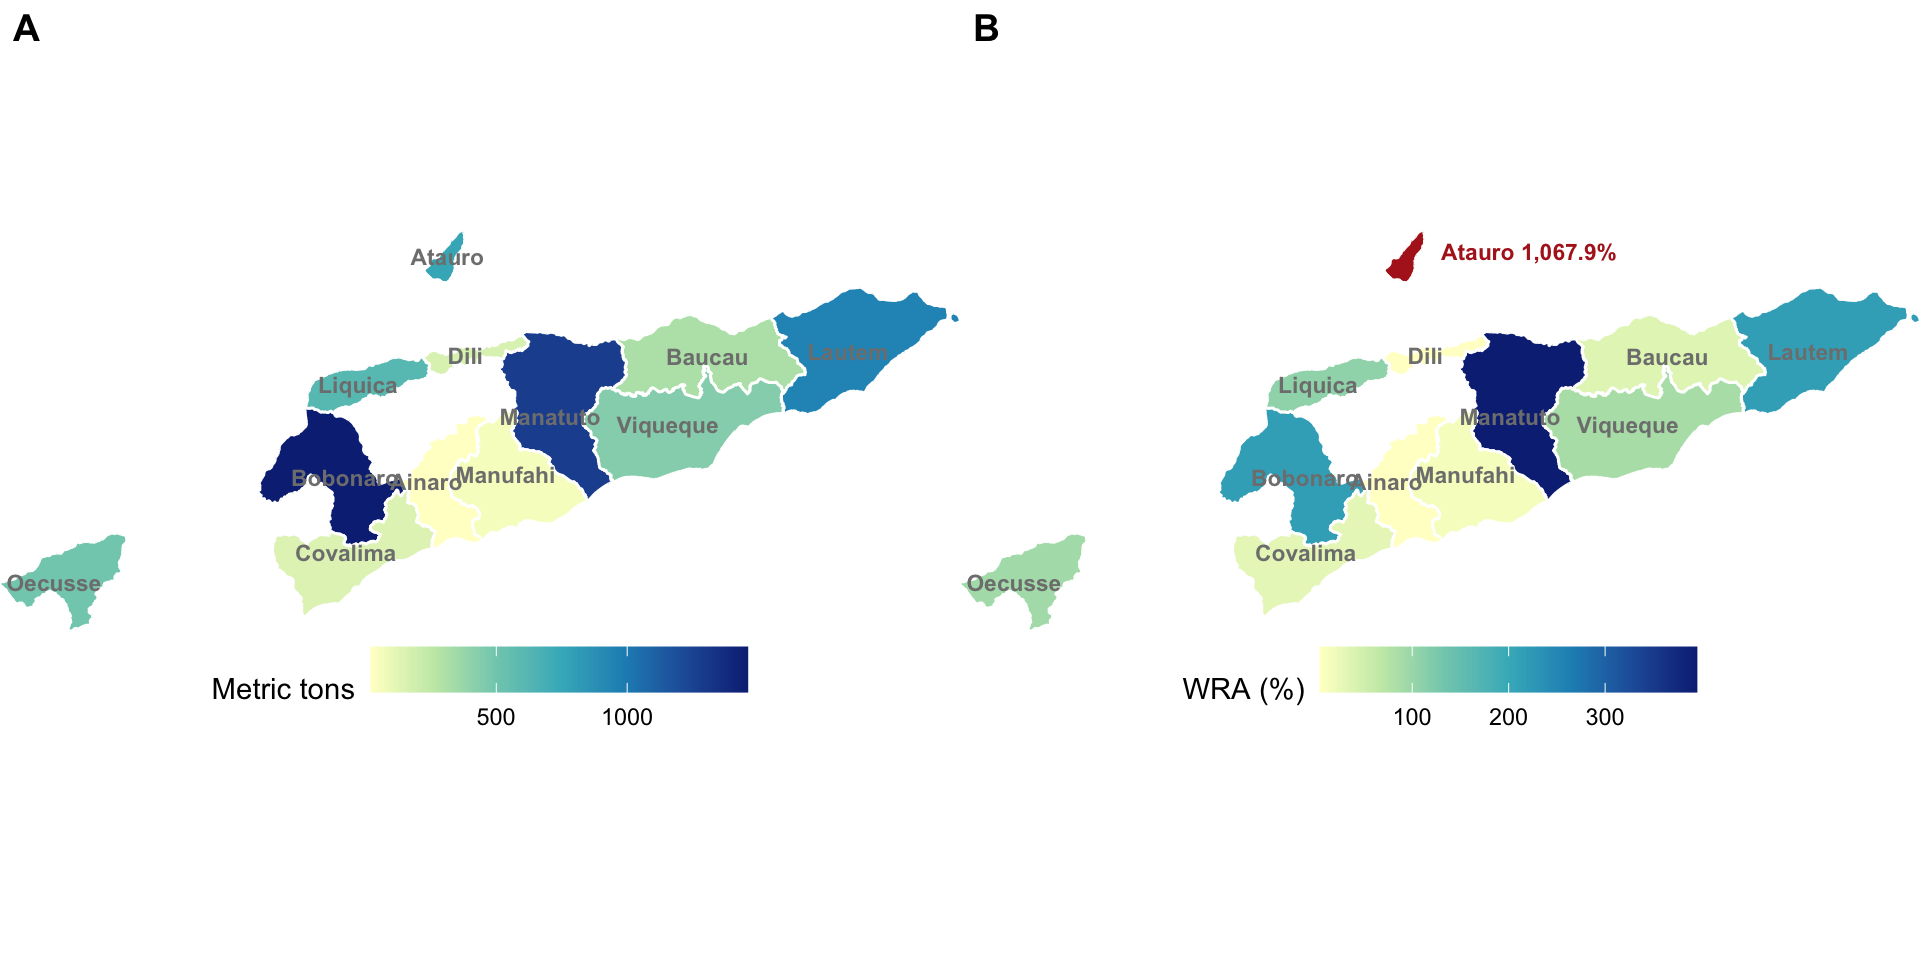
p1 <-
ggplot(data = region_nutr) +
geom_sf(aes(geometry = geometry, fill = annual_catch_tot),
color = "white", linewidth = 0.5
) +
theme_void() +
geom_sf_text(aes(label = region, geometry = geometry), size = 3, color = "grey50", fontface = "bold") +
# scale_fill_viridis_c(option = "viridis", direction = -1, begin = 0.3, end = 1, alpha = 0.7) +
scale_fill_distiller(palette = "YlGnBu", direction = 1) +
guides(alpha = "none") +
coord_sf(expand = FALSE) +
theme(
legend.position = "bottom",
legend.key.width = unit(1, "cm"),
panel.grid = element_blank(),
axis.ticks = element_blank(),
axis.title = element_blank(),
axis.text = element_blank()
) +
labs(
fill = "Metric tons"
)
p2 <-
ggplot() +
geom_sf(
data = region_nutr %>%
dplyr::filter(!region == "Atauro"), mapping = aes(geometry = geometry, fill = WRA),
color = "white", linewidth = 0.5
) +
geom_sf(
data = region_nutr %>%
dplyr::filter(region == "Atauro"), mapping = aes(geometry = geometry), fill = "firebrick",
color = "white", linewidth = 0.5
) +
theme_void() +
geom_sf_text(data = region_nutr %>%
dplyr::filter(!region == "Atauro"), mapping = aes(label = region, geometry = geometry), size = 3, color = "grey50", fontface = "bold") +
annotate(
"text",
x = 126, y = -8.2, label = "Atauro 747%", size = 3, color = "firebrick", fontface = "bold"
) +
# annotate(
# "text", x = 125.8, y = -8.2, label = "1067.9%", size = 3, color = "firebrick", fontface = "bold"
# ) +
scale_fill_distiller(palette = "YlGnBu", direction = 1) +
guides(alpha = "none") +
coord_sf(expand = FALSE) +
theme(
plot.margin = margin(0, 0, 0, 0, "cm"),
legend.position = "bottom",
legend.key.width = unit(1, "cm"),
panel.grid = element_blank(),
axis.ticks = element_blank(),
axis.title = element_blank(),
axis.text = element_blank()
) +
labs(
fill = "WRA (%)"
)
#title = "WRA that would meet the recommended quantity of edible fish annually,\nfrom marine catches by municipality"
#title = "Timor-Leste small scale fisheries production",
#subtitle = "Annual catch in Mt per municipality, average (2020-2022)"
cowplot::plot_grid(
p1 + theme(plot.margin = margin(0, 0, 0, 0, "cm")),
p2 + theme(plot.margin = margin(0, 0, 0, 0, "cm")),
ncol = 2,
labels = "AUTO",
rel_widths = c(1, 1),
align = "hv"
)