library(ggplot2)
catch_groups_name <-
timor.nutrients::catch_groups %>%
dplyr::select(
grouped_taxa = interagency_code,
catch_name
)
tot_catch <-
timor.nutrients::region_stats %>%
dplyr::mutate(year = lubridate::year(date_bin_start)) %>%
dplyr::group_by(grouped_taxa, year) %>%
dplyr::summarise(catch = sum(catch)) %>%
dplyr::group_by(grouped_taxa) %>%
dplyr::summarise(catch = mean(catch)) %>%
dplyr::left_join(catch_groups_name) %>%
dplyr::select(-grouped_taxa) %>%
dplyr::select(catch_name, catch) %>%
dplyr::mutate(catch = catch / 1000)
base_plot <-
timor.nutrients::nutrients_table %>%
dplyr::left_join(catch_groups_name) %>%
dplyr::select(catch_name, grouped_taxa, Selenium_mu:Vitamin_A_mu) %>%
rename_nutrients_mu(hyphen = FALSE) %>%
tidyr::pivot_longer(-c(catch_name, grouped_taxa), names_to = "nutrient", values_to = "concentration") %>%
dplyr::filter(!nutrient == "selenium" & !catch_name %in% "Other") %>%
dplyr::left_join(RDI_tab) %>%
dplyr::mutate(
nutrient = stringr::str_to_title(nutrient),
nutrient = dplyr::case_when(
nutrient == "Omega3" ~ "Omega-3",
nutrient == "Vitamina" ~ "Vitamin-A",
TRUE ~ nutrient
)
) %>%
dplyr::mutate(rdi = (concentration * 100) / conv_factor) %>%
dplyr::group_by(catch_name) %>%
dplyr::mutate(tot = sum(rdi, na.rm = T)) %>%
dplyr::arrange(-tot) %>%
dplyr::left_join(tot_catch) %>%
tidyr::replace_na(list(catch = 0)) %>%
dplyr::arrange(dplyr::desc(nutrient)) %>%
dplyr::ungroup() %>%
dplyr::mutate(
fish_group = dplyr::case_when(
grouped_taxa %in% c("COZ", "CUX") ~ "Molluscs",
grouped_taxa %in% c("PEZ") ~ "Shrimps",
grouped_taxa %in% c("MZZ") ~ "Other",
grouped_taxa %in% c("SLV", "CRA") ~ "Crustaceans",
grouped_taxa %in% c("OCZ", "IAX") ~ "Cephalopods",
grouped_taxa %in% c("SKH", "SRX") ~ "Sharks and rays",
grouped_taxa %in% c("SNA", "GPX", "PWT", "GRX", "MUI", "BGX") ~ "Large demersals",
grouped_taxa %in% c("CGX", "TUN", "BEN", "LWX", "BAR", "SFA", "CBA", "DOX", "ECN", "DOS") ~ "Large pelagics",
grouped_taxa %in% c("YDX", "SPI", "EMP", "SUR", "TRI", "MOJ", "WRA", "BWH", "LGE", "MOB", "MHL", "GOX", "THO", "IHX", "APO", "IHX", "PUX", "DRZ", "DSF") ~ "Small demersals",
grouped_taxa %in% c("RAX", "SDX", "CJX", "CLP", "GZP", "FLY", "KYX", "MOO", "CLP", "MUL", "MIL", "THF") ~ "Small pelagics",
TRUE ~ NA_character_
),
fish_group = ifelse(fish_group %in% c("Shrimps", "Molluscs", "Cephalopods", "Crustaceans"), "Marine invertebrates", fish_group),
)
tot_catch_plot <-
base_plot %>%
dplyr::group_by(catch_name) %>% # Added .drop false to ensure that all factor levels remain in plot
dplyr::summarise(
catch_t = dplyr::first(catch),
tot_t = dplyr::first(tot)
)
# base_plot %>% View()
base_plot <-
dplyr::left_join(base_plot, tot_catch_plot, by = "catch_name") %>%
dplyr::filter(catch_t > 0) %>%
dplyr::mutate(
VarColor = dplyr::case_when(
fish_group == "Small pelagics" ~ "#bc4749",
fish_group == "Small demersals" ~ "#e9c46a",
fish_group == "Large pelagics" ~ "#2a9d8f",
fish_group == "Large demersals" ~ "#007ea7",
fish_group == "Sharks and rays" ~ "#264653",
fish_group == "Marine invertebrates" ~ "#898989",
TRUE ~ "#000000"
),
ColoredVar = glue::glue("<span style='color:{VarColor}'>{catch_name}</span>"),
fish_group = factor(fish_group, levels = c(
"Small pelagics", "Large pelagics", "Small demersals", "Large demersals",
"Sharks and rays", "Marine invertebrates"
))
)
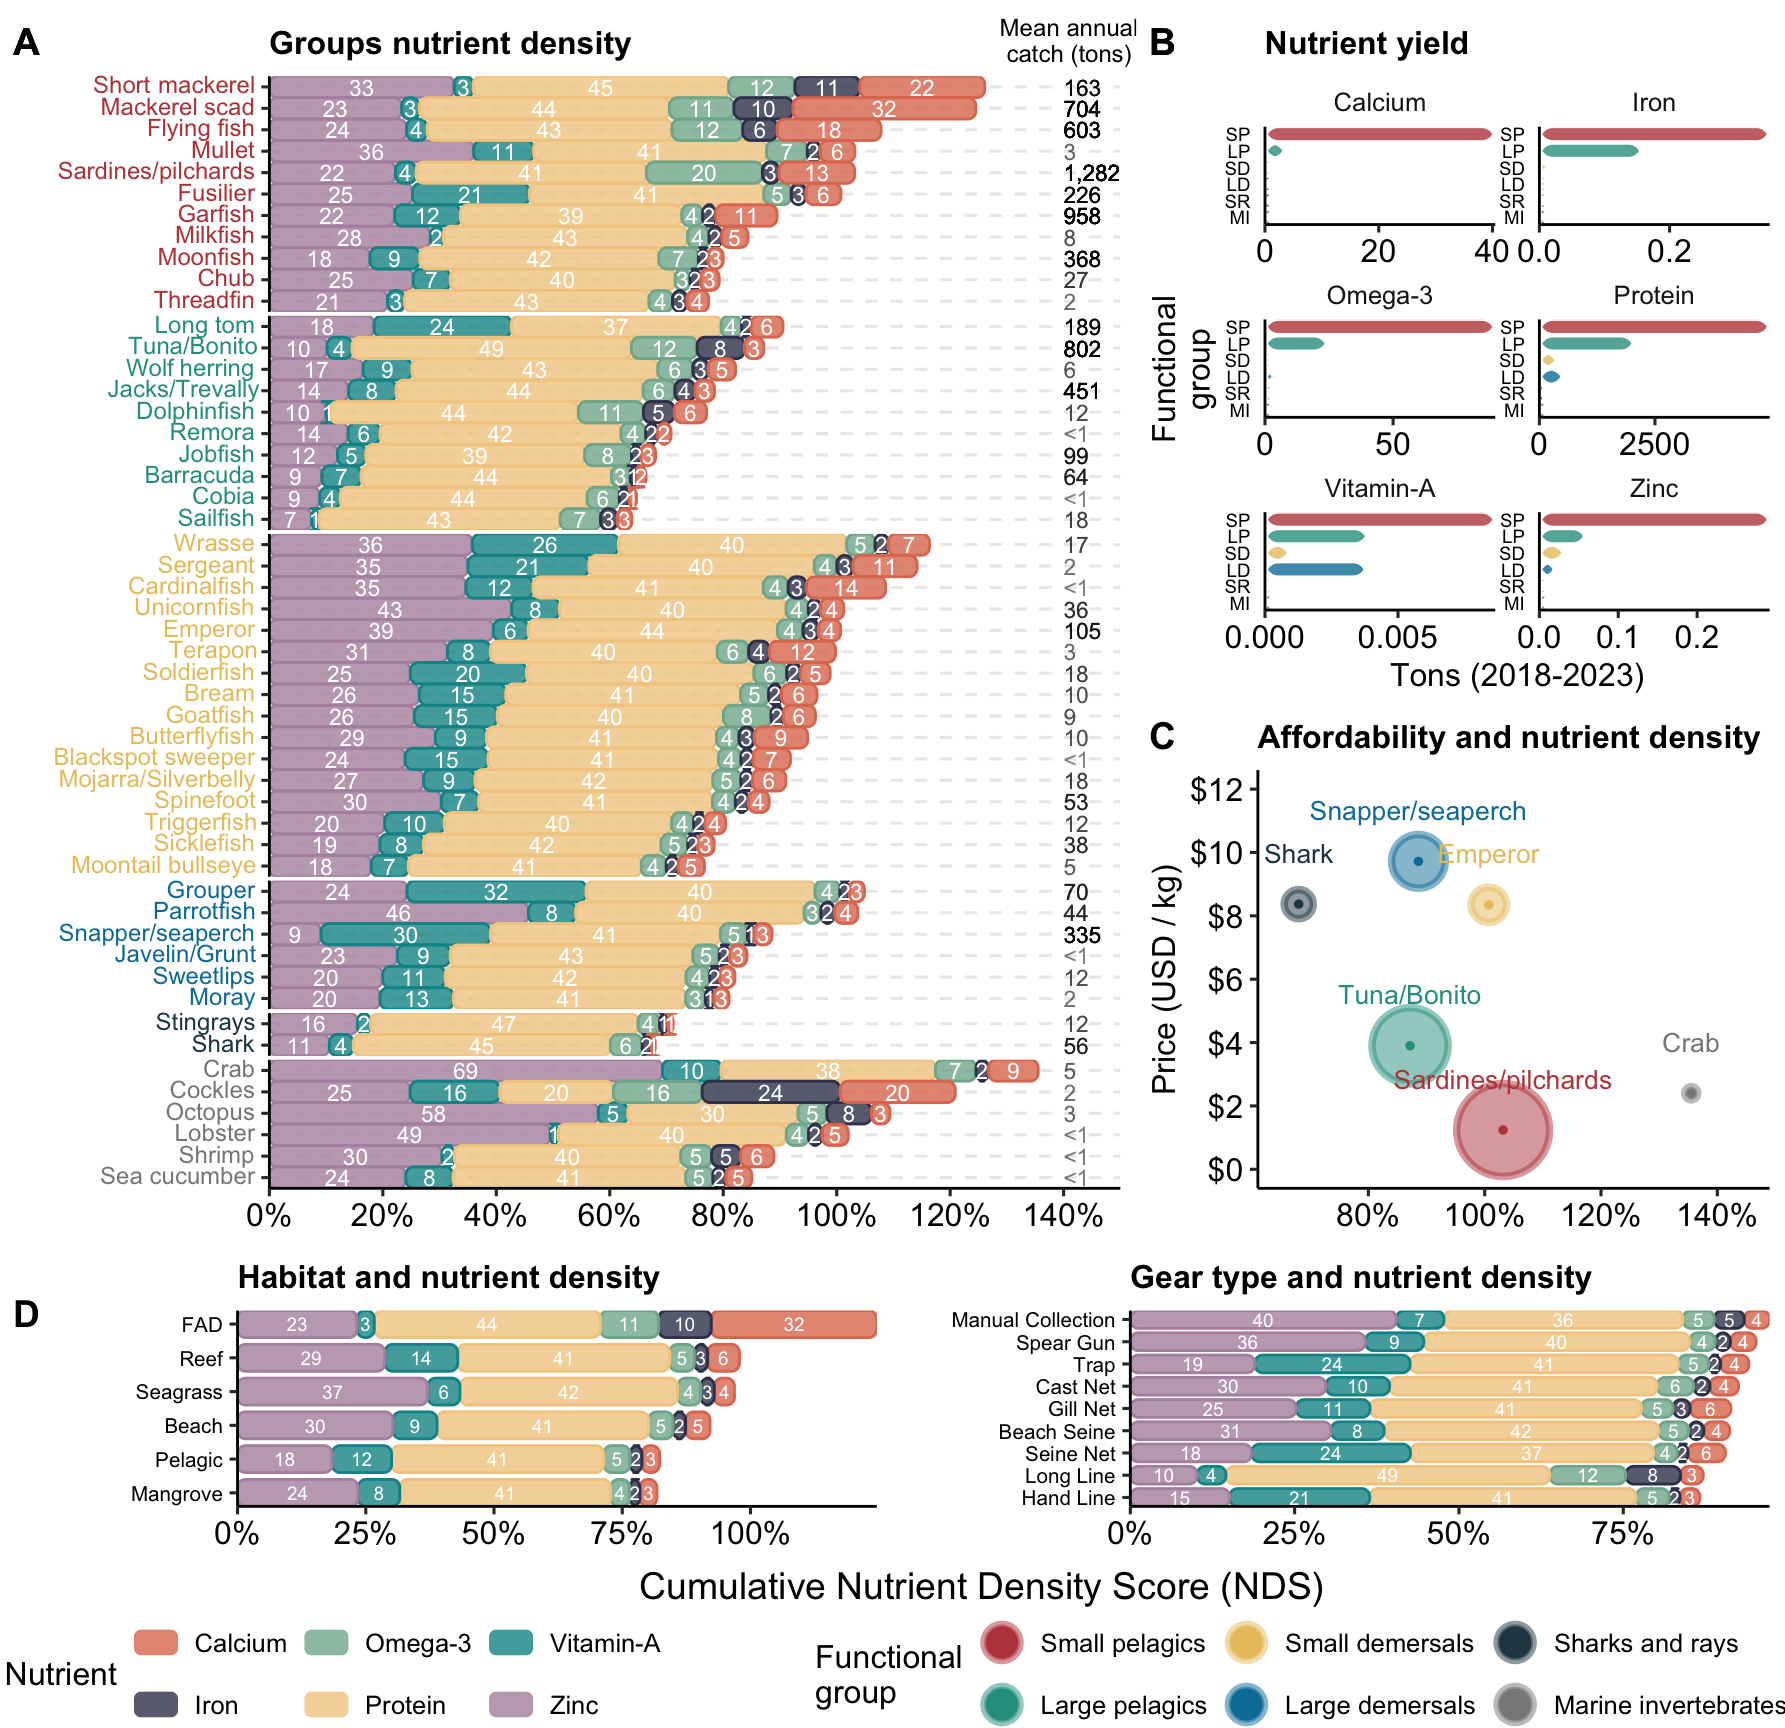
tons_label <- cowplot::draw_label("Mean annual\ncatch (tons)", x = 0.941, y = 0.98, size = 9)
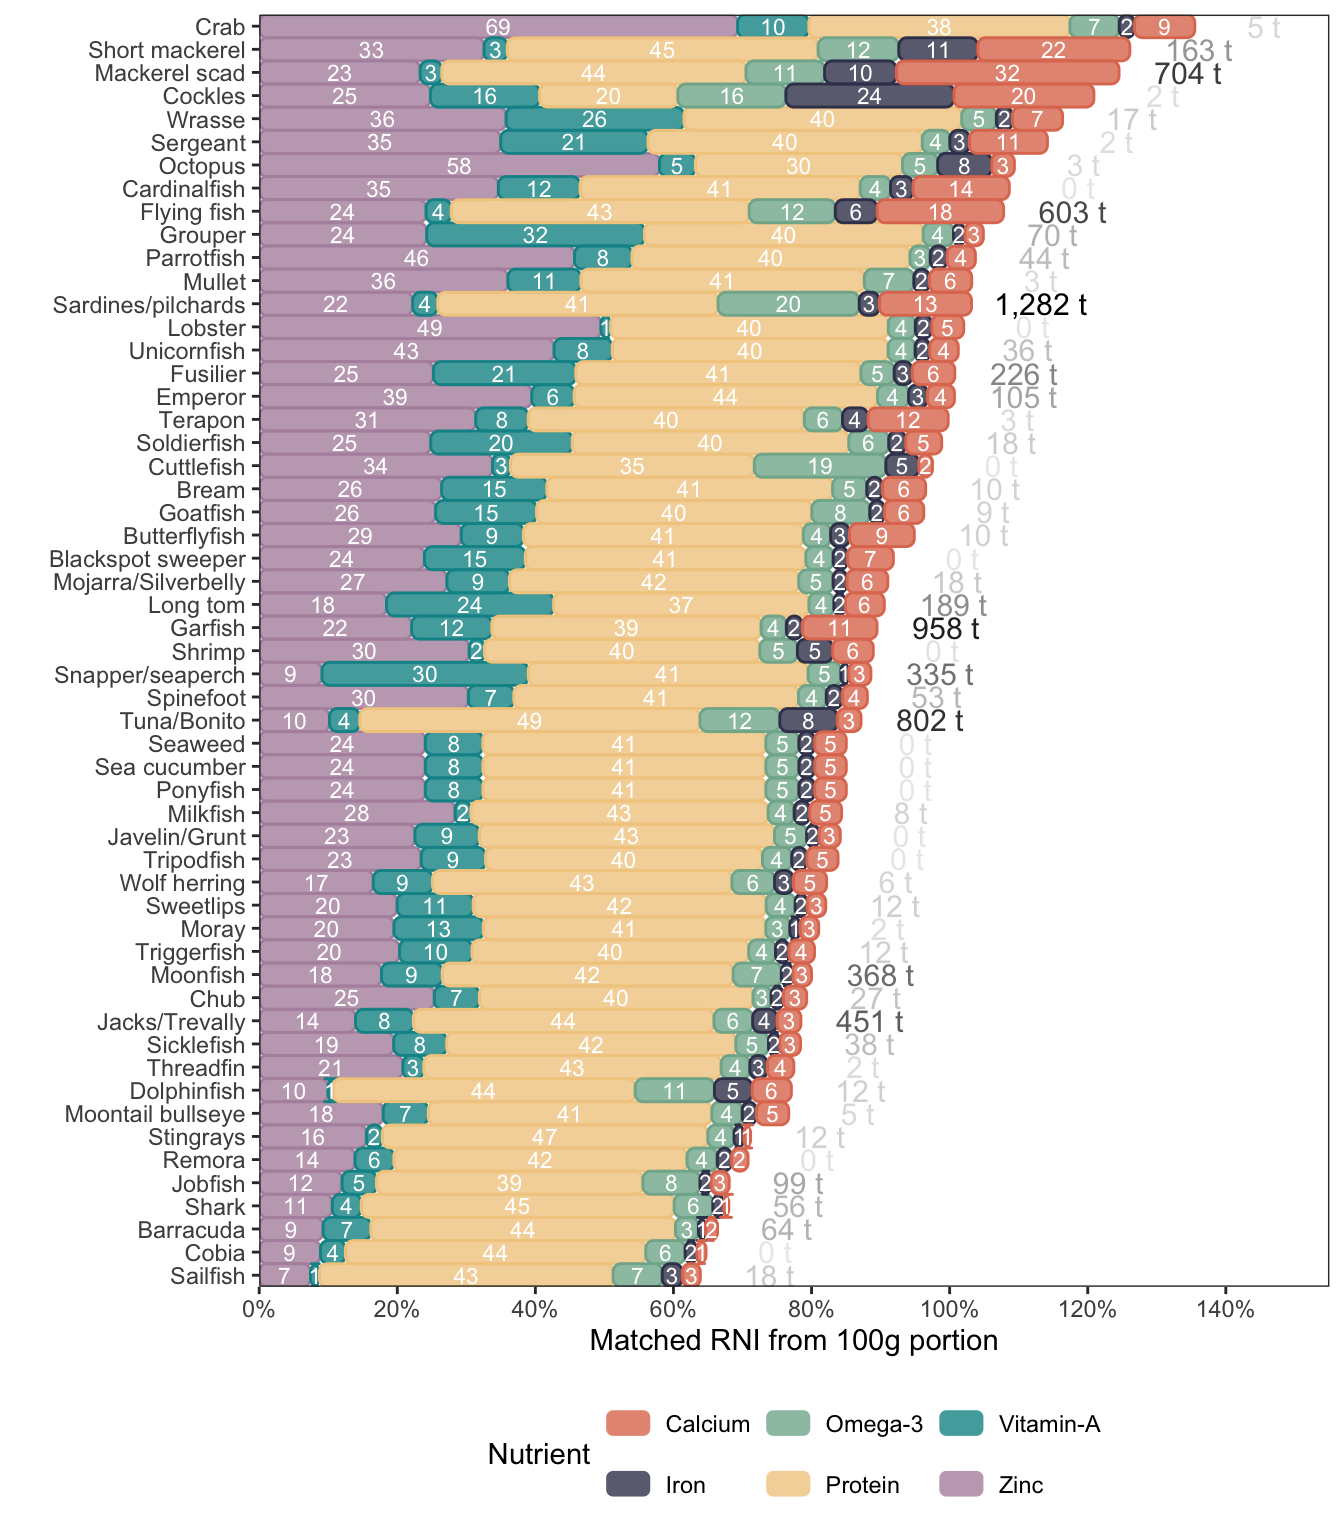
long_plot <-
ggplot2::ggplot() +
ggpubr::theme_pubr() +
ggchicklet::geom_chicklet(base_plot,
mapping = ggplot2::aes(
y = rdi, x = reorder(ColoredVar, tot),
fill = nutrient,
color = nutrient
),
position = ggplot2::position_stack(reverse = FALSE),
alpha = 0.8,
width = 1
) +
geom_text(base_plot,
mapping = aes(y = rdi, x = reorder(ColoredVar, tot), label = round(rdi, 2) * 100),
position = position_stack(0.5),
color = "white",
size = 3
) +
geom_text(
data = base_plot,
mapping = aes(
# Set y to a fixed position above the bars
y = 1.35, # Adjust this value if needed
x = reorder(ColoredVar, tot_t),
label = ifelse(catch_t < 1, "<1", scales::comma(round(catch_t, 0))),
alpha = sqrt(catch_t),
),
size = 3,
hjust = 0, # Left-align the text
nudge_y = 0.05
) +
facet_grid(fish_group ~ ., scales = "free", space = "free") +
coord_flip(expand = FALSE, ylim = c(0, 1.5)) +
ggplot2::scale_fill_manual(values = timor.nutrients::palettes$nutrients_palette) +
ggplot2::scale_color_manual(values = timor.nutrients::palettes$nutrients_palette) +
ggplot2::scale_y_continuous(labels = scales::percent, n.breaks = 10) +
ggplot2::labs(x = "", y = "", fill = "Nutrient", subtitle = "Groups nutrient density") +
ggplot2::theme(
legend.position = "bottom",
panel.grid.major.y = element_line(linetype = "dashed"),
strip.background = ggplot2::element_blank(),
strip.text = ggplot2::element_blank(),
axis.text.y = ggtext::element_markdown(size = 9),
panel.spacing = unit(0.1, "lines"),
plot.subtitle = element_text(face = "bold")
) +
guides(
alpha = "none",
color = "none"
)
long_legend <- ggpubr::get_legend(long_plot)
long_plot <- long_plot +
theme(legend.position = "none")
long_plot <- cowplot::plot_grid(long_plot) + tons_label
# groups_palette <- c("#2a9d8f", "#264653", "#007ea7", "#e9c46a", "#898989", "#bc4749")
groups_palette <- c("#bc4749", "#2a9d8f", "#e9c46a", "#007ea7", "#264653", "#898989")
groups_plot <-
timor.nutrients::region_stats_adj %>%
dplyr::mutate(fish_group = dplyr::case_when(
grouped_taxa %in% c("COZ") ~ "Molluscs",
grouped_taxa %in% c("PEZ") ~ "Shrimps",
grouped_taxa %in% c("MZZ") ~ "Other",
grouped_taxa %in% c("SLV", "CRA") ~ "Crustaceans",
grouped_taxa %in% c("OCZ", "IAX") ~ "Cephalopods",
grouped_taxa %in% c("SKH", "SRX") ~ "Sharks and rays",
grouped_taxa %in% c("SNA", "GPX", "PWT", "GRX", "MUI", "BGX") ~ "Large demersals",
grouped_taxa %in% c("CGX", "TUN", "BEN", "LWX", "BAR", "SFA", "CBA", "DOX", "ECN", "DOS") ~ "Large pelagics",
grouped_taxa %in% c("YDX", "SPI", "EMP", "SUR", "TRI", "MOJ", "WRA", "BWH", "LGE", "MOB", "MHL", "GOX", "THO", "IHX", "APO", "IHX", "PUX", "DRZ") ~ "Small demersals",
grouped_taxa %in% c("RAX", "SDX", "CJX", "CLP", "GZP", "FLY", "KYX", "MOO", "CLP", "MUL", "DSF", "MIL", "THF") ~ "Small pelagics",
TRUE ~ NA_character_
)) %>%
dplyr::select(-grouped_taxa) %>%
dplyr::group_by(fish_group) %>%
dplyr::summarise(dplyr::across(dplyr::where(is.numeric), ~ sum(.x, na.rm = T))) %>%
na.omit() %>%
tidyr::pivot_longer(-c(fish_group, catch), names_to = "nutrient") %>%
dplyr::group_by(nutrient, fish_group) %>%
dplyr::summarise(value = sum(value)) %>%
dplyr::arrange(-value, .by_group = TRUE) %>%
dplyr::select(fish_group, nutrient, value) %>%
dplyr::ungroup() %>%
dplyr::mutate(
nutrient = as.factor(nutrient),
fish_group = ifelse(fish_group %in% c("Shrimps", "Molluscs", "Cephalopods", "Crustaceans"), "Marine invertebrates", fish_group),
fish_group = factor(fish_group, levels = c(
"Shrimps", "Molluscs", "Cephalopods", "Crustaceans",
"Marine invertebrates", "Sharks and rays", "Large demersals",
"Small demersals", "Large pelagics", "Small pelagics"
))
) %>%
dplyr::filter(!nutrient == "selenium") %>%
dplyr::mutate(
nutrient = stringr::str_to_title(nutrient),
nutrient = dplyr::case_when(
nutrient == "Omega3" ~ "Omega-3",
nutrient == "Vitamina" ~ "Vitamin-A",
TRUE ~ nutrient
),
fish_label = dplyr::case_when(
fish_group == "Small pelagics" ~ "SP",
fish_group == "Large pelagics" ~ "LP",
fish_group == "Small demersals" ~ "SD",
fish_group == "Large demersals" ~ "LD",
fish_group == "Sharks and rays" ~ "SR",
fish_group == "Marine invertebrates" ~ "MI"
),
fish_label = factor(fish_label, levels = rev(c(
"SP", "LP", "SD", "LD", "SR", "MI"
)))
) %>%
ggplot(aes(fish_label, value / 1000, fill = fish_label)) +
ggpubr::theme_pubr() +
ggchicklet::geom_chicklet(
alpha = 0.8,
radius = grid::unit(5, "pt")
) +
facet_wrap(. ~ nutrient, scales = "free", ncol = 2) +
labs(y = "Tons (2018-2023)", x = "Functional\ngroup", fill = "Fish group", subtitle = "Nutrient yield") +
theme(
legend.position = "",
panel.grid = element_blank(),
strip.background = ggplot2::element_blank(), # This removes the background from the facet titles
axis.text.y = element_text(size = 7),
axis.ticks.y = ggplot2::element_blank(),
panel.spacing.x = unit(0.1, "lines"),
panel.spacing.y = unit(0, "lines"),
plot.subtitle = element_text(face = "bold")
) +
scale_fill_manual(
values = groups_palette,
breaks = c(
"SP", "LP", "SD", "LD",
"SR", "MI"
)
) +
scale_y_continuous(n.breaks = 3) +
coord_flip(expand = F)
###
groups_palette <- c("#bc4749", "#2a9d8f", "#e9c46a", "#007ea7", "#264653", "#898989")
top_groups <-
timor.nutrients::region_stats %>%
dplyr::select(grouped_taxa, catch) %>%
dplyr::mutate(
tot_catch = sum(catch, na.rm = T),
fish_group = dplyr::case_when(
grouped_taxa %in% c("COZ") ~ "Molluscs",
grouped_taxa %in% c("PEZ") ~ "Shrimps",
grouped_taxa %in% c("MZZ") ~ "Other",
grouped_taxa %in% c("SLV", "CRA") ~ "Crustaceans",
grouped_taxa %in% c("OCZ", "IAX") ~ "Cephalopods",
grouped_taxa %in% c("SKH", "SRX") ~ "Sharks and rays",
grouped_taxa %in% c("SNA", "GPX", "PWT", "GRX", "MUI", "BGX") ~ "Large demersals",
grouped_taxa %in% c("CGX", "TUN", "BEN", "LWX", "BAR", "SFA", "CBA", "DOX", "ECN", "DOS") ~ "Large pelagics",
grouped_taxa %in% c("YDX", "SPI", "EMP", "SUR", "TRI", "MOJ", "WRA", "BWH", "LGE", "MOB", "MHL", "GOX", "THO", "IHX", "APO", "IHX", "PUX", "DRZ") ~ "Small demersals",
grouped_taxa %in% c("RAX", "SDX", "CJX", "CLP", "GZP", "FLY", "KYX", "MOO", "CLP", "MUL", "DSF", "MIL", "THF") ~ "Small pelagics",
TRUE ~ NA_character_
)
) %>%
dplyr::mutate(fish_group = ifelse(fish_group %in% c("Shrimps", "Molluscs", "Cephalopods", "Crustaceans"), "Marine invertebrates", fish_group)) %>%
dplyr::group_by(fish_group, grouped_taxa) %>%
dplyr::summarise(
tot_catch = dplyr::first(tot_catch),
catch = sum(catch, na.rm = T),
catch_percent = catch / tot_catch * 100
) %>%
dplyr::group_by(fish_group) %>%
dplyr::slice_max(catch_percent, n = 1) %>%
dplyr::arrange(-catch_percent, .by_group = T) %>%
na.omit() %>%
dplyr::rename(interagency_code = "grouped_taxa") %>%
dplyr::left_join(timor.nutrients::catch_groups, by = "interagency_code") %>%
dplyr::select(fish_group, catch_name, interagency_code, catch_percent) %>%
dplyr::ungroup()
revenue_dat <-
timor.nutrients::catch_data %>%
tidyr::unnest(landing_catch) %>%
tidyr::unnest(length_frequency) %>%
dplyr::filter(!is.na(.data$weight), !is.na(landing_value)) %>%
dplyr::group_by(landing_id) %>%
dplyr::mutate(n = dplyr::n()) %>%
dplyr::filter(n == 1) %>%
dplyr::select(-n) %>%
dplyr::ungroup() %>%
dplyr::mutate(tot_obs = length(unique(landing_id))) %>%
dplyr::group_by(catch_taxon) %>%
dplyr::filter(catch_taxon %in% top_groups$interagency_code) %>%
dplyr::group_by(.data$landing_id, .data$catch_taxon) %>%
dplyr::summarise(
landing_value = dplyr::first(landing_value),
dplyr::across(
c(.data$weight:.data$Vitamin_A_mu),
~ sum(.x)
)
)
models <-
revenue_dat %>%
dplyr::ungroup() %>%
dplyr::select(catch_taxon, landing_value, weight) %>%
# dplyr::group_by(catch_taxon) %>%
# dplyr::mutate(model = broom::augment(stats::lm(formula = log(landing_value + 1) ~ log(weight / 1000 + 1)))) %>%
# dplyr::ungroup() %>%
# dplyr::mutate(cooksd = .data$model$`.cooksd`) %>%
# dplyr::select(-.data$model) %>%
# dplyr::mutate(out = dplyr::case_when(.data$cooksd > (5 * mean(.data$cooksd)) ~ 1, TRUE ~ 0)) %>%
# dplyr::filter(out == 0) %>%
# dplyr::select(-out, -cooksd) %>%
dplyr::select(catch_taxon, landing_value, weight) %>%
split(.$catch_taxon) %>%
purrr::map(~ lm(log(landing_value) ~ log(weight), data = .x)) %>%
purrr::map(~ predict(.x, data.frame(weight = log(1000)))) %>%
dplyr::bind_rows(.id = "catch_taxon") %>%
dplyr::rename(price = `1`) %>%
dplyr::mutate(price = round(exp(price) * 10, 2))
revenue_dat <-
revenue_dat %>%
rename_nutrients_mu() %>%
tidyr::pivot_longer(-c(landing_id:weight), names_to = "nutrient") %>%
dplyr::filter(!nutrient == "selenium") %>%
dplyr::left_join(RDI_tab) %>%
dplyr::ungroup() %>%
dplyr::mutate(
value = value / weight * 100,
inds = value / conv_factor * 100
) %>%
dplyr::group_by(landing_id, catch_taxon) %>%
dplyr::mutate(inds_100 = sum(inds)) %>%
dplyr::group_by(catch_taxon) %>%
dplyr::summarise(
inds = dplyr::first(inds_100)
) %>%
dplyr::left_join(models) %>%
dplyr::rename(interagency_code = catch_taxon) %>%
dplyr::left_join(timor.nutrients::catch_groups, by = "interagency_code") %>%
dplyr::left_join(top_groups, by = "catch_name") %>%
dplyr::select(fish_group, catch_name, price, inds, catch_percent)
revenue_plot <-
revenue_dat %>%
dplyr::mutate(fish_group = factor(fish_group, levels = c(
"Small pelagics", "Large pelagics", "Small demersals", "Large demersals",
"Sharks and rays", "Marine invertebrates"
))) %>%
# dplyr::filter(!catch_name %in% c("Stingrays")) %>%
ggplot(aes(inds, price, size = catch_percent, color = fish_group)) +
ggpubr::theme_pubr() +
geom_point(stroke = 2, alpha = 0.5) +
geom_point(size = 1) +
geom_text(aes(label = catch_name, color = fish_group), size = 3.5, vjust = -2.2, show.legend = FALSE) +
scale_size(range = c(1, 15)) +
coord_cartesian(
ylim = c(0, 12),
xlim = c(65, 145)
) +
scale_x_continuous(labels = scales::label_percent(scale = 1), n.breaks = 5) +
scale_y_continuous(labels = scales::label_dollar(), n.breaks = 8) +
scale_color_manual(values = groups_palette) +
theme(
panel.grid = element_blank(),
legend.position = "bottom",
plot.subtitle = element_text(face = "bold")
) +
guides(
size = "none",
colour = guide_legend(override.aes = list(size = 5))
) +
labs(
x = "",
y = "Price (USD / kg)",
subtitle = "Affordability and nutrient density",
color = "Functional\ngroup"
)
groups_leg <- ggpubr::get_legend(revenue_plot)
revenue_plot <-
revenue_plot +
theme(legend.position = "none")
habitat_nutrients <-
timor.nutrients::kobo_trips %>%
dplyr::select(habitat, weight:Vitamin_A_mu) %>%
rename_nutrients_mu() %>%
tidyr::pivot_longer(-c(habitat, weight), names_to = "nutrient") %>%
dplyr::left_join(RDI_tab) %>%
dplyr::mutate(
value = value / weight,
inds_kg = (value * 1000) / conv_factor
) %>%
dplyr::group_by(habitat, nutrient) %>%
dplyr::summarise(inds_kg = median(inds_kg, na.rm = T) / 10) %>%
dplyr::mutate(inds_kg = inds_kg * 100) %>%
dplyr::filter(!nutrient == "selenium") %>%
dplyr::mutate(
habitat = ifelse(habitat == "Deep", "Pelagic", habitat),
nutrient = stringr::str_to_title(nutrient),
nutrient = dplyr::case_when(
nutrient == "Omega3" ~ "Omega-3",
nutrient == "Vitamina" ~ "Vitamin-A",
TRUE ~ nutrient
)
)
habitat_plot <-
ggplot2::ggplot() +
ggpubr::theme_pubr() +
ggchicklet::geom_chicklet(habitat_nutrients,
mapping = ggplot2::aes(
y = inds_kg,
x = reorder(habitat, inds_kg),
fill = nutrient,
color = nutrient
),
position = ggplot2::position_stack(reverse = FALSE),
alpha = 0.8,
width = 0.8,
radius = grid::unit(3, "pt")
) +
ggplot2::geom_text(habitat_nutrients,
mapping = ggplot2::aes(
y = inds_kg,
x = reorder(habitat, inds_kg),
label = round(inds_kg, 0),
group = nutrient
),
position = ggplot2::position_stack(0.5, reverse = FALSE),
color = "white",
size = 2.5
) +
ggplot2::scale_fill_manual(values = timor.nutrients::palettes$nutrients_palette) +
ggplot2::scale_color_manual(values = timor.nutrients::palettes$nutrients_palette) +
ggplot2::scale_y_continuous(labels = scales::label_percent(scale = 1)) +
ggplot2::coord_flip(expand = FALSE) +
ggplot2::theme(
legend.position = "",
panel.grid = ggplot2::element_blank(),
axis.text.y = element_text(size = 7.75),
plot.subtitle = element_text(face = "bold")
) +
ggplot2::labs(x = "", fill = "", y = "Cumulative nutrient density score", subtitle = "Habitat and nutrient density") +
ggplot2::guides(
alpha = "none",
color = "none",
fill = guide_legend(override.aes = list(size = 7))
)
gear_nutrients <-
timor.nutrients::kobo_trips %>%
dplyr::select(gear_type, weight:Vitamin_A_mu) %>%
rename_nutrients_mu() %>%
tidyr::pivot_longer(-c(gear_type, weight), names_to = "nutrient") %>%
dplyr::left_join(RDI_tab) %>%
dplyr::mutate(
value = value / weight,
inds_kg = (value * 1000) / conv_factor
) %>%
dplyr::group_by(gear_type, nutrient) %>%
dplyr::summarise(inds_kg = median(inds_kg, na.rm = T) / 10) %>%
dplyr::mutate(inds_kg = inds_kg * 100) %>%
dplyr::filter(!nutrient == "selenium") %>%
dplyr::mutate(
nutrient = stringr::str_to_title(nutrient),
nutrient = dplyr::case_when(
nutrient == "Omega3" ~ "Omega-3",
nutrient == "Vitamina" ~ "Vitamin-A",
TRUE ~ nutrient
)
) %>%
dplyr::mutate(gear_type = stringr::str_to_title(gear_type)) %>%
dplyr::ungroup()
gear_nutrients <-
ggplot2::ggplot() +
ggpubr::theme_pubr() +
ggchicklet::geom_chicklet(gear_nutrients,
mapping = ggplot2::aes(
y = inds_kg,
x = reorder(gear_type, inds_kg),
fill = nutrient,
color = nutrient
),
position = ggplot2::position_stack(reverse = FALSE),
alpha = 0.8,
width = 0.8,
radius = grid::unit(3, "pt")
) +
ggplot2::geom_text(gear_nutrients,
mapping = ggplot2::aes(
y = inds_kg,
x = reorder(gear_type, inds_kg),
label = round(inds_kg, 0),
group = nutrient
),
position = ggplot2::position_stack(0.5, reverse = FALSE),
color = "white",
size = 2.5
) +
ggplot2::scale_fill_manual(values = timor.nutrients::palettes$nutrients_palette) +
ggplot2::scale_color_manual(values = timor.nutrients::palettes$nutrients_palette) +
ggplot2::scale_y_continuous(labels = scales::label_percent(scale = 1)) +
ggplot2::coord_flip(expand = FALSE) +
ggplot2::theme(
legend.position = "",
panel.grid = ggplot2::element_blank(),
axis.text.y = element_text(size = 7.75),
plot.subtitle = element_text(face = "bold")
) +
ggplot2::labs(x = "", fill = "", y = "Cumulative nutrient density score", subtitle = "Gear type and nutrient density") +
ggplot2::guides(
alpha = "none",
color = "none",
fill = guide_legend(override.aes = list(size = 7))
)
second_row_plot <- cowplot::plot_grid(
groups_plot, #+ theme(plot.margin = unit(c(0, 0, 0, +2.2), "cm")),
revenue_plot,
ncol = 1,
align = "hv",
labels = c("B", "C"),
rel_heights = c(1.2, 1)
)
p1 <-
cowplot::plot_grid(
long_plot,
second_row_plot,
ncol = 2,
align = "hv",
rel_widths = c(1.75, 1),
labels = "AUTO"
)
bottom_row_plot <- cowplot::plot_grid(
habitat_plot + labs(y = ""),
gear_nutrients + labs(y = ""),
ncol = 2,
align = "hv",
labels = c("", ""),
rel_heights = c(1, 1)
)
p2 <- cowplot::plot_grid(
p1 + theme(plot.margin = unit(c(0, 0, 0, 0), "cm")),
bottom_row_plot + theme(plot.margin = unit(c(-0.5, 0, 0, 0), "cm")),
nrow = 2,
labels = c("A", "D"),
rel_heights = c(1, 0.25),
align = "v" # align vertically
)
legends <-
cowplot::plot_grid(
long_legend, groups_leg
)
x_label <- cowplot::draw_label("Cumulative Nutrient Density Score (NDS)", x = 0.55, y = 0.0825)
cowplot::plot_grid(
p2,
legends + theme(plot.margin = unit(c(0.19, 0, 0, -2), "cm")),
nrow = 2,
align = "h",
rel_heights = c(1.3, 0.1)
) +
x_label