The goal of aquadata.data.mapping is to collect metadata within the context aquatic food systems in order to identify data gaps and generate new data in key geographic region: Bangladesh, Cambodia, Ghana, India, Myanmar, Nigeria, Solomon Islands, Timor-Leste and Zambia.

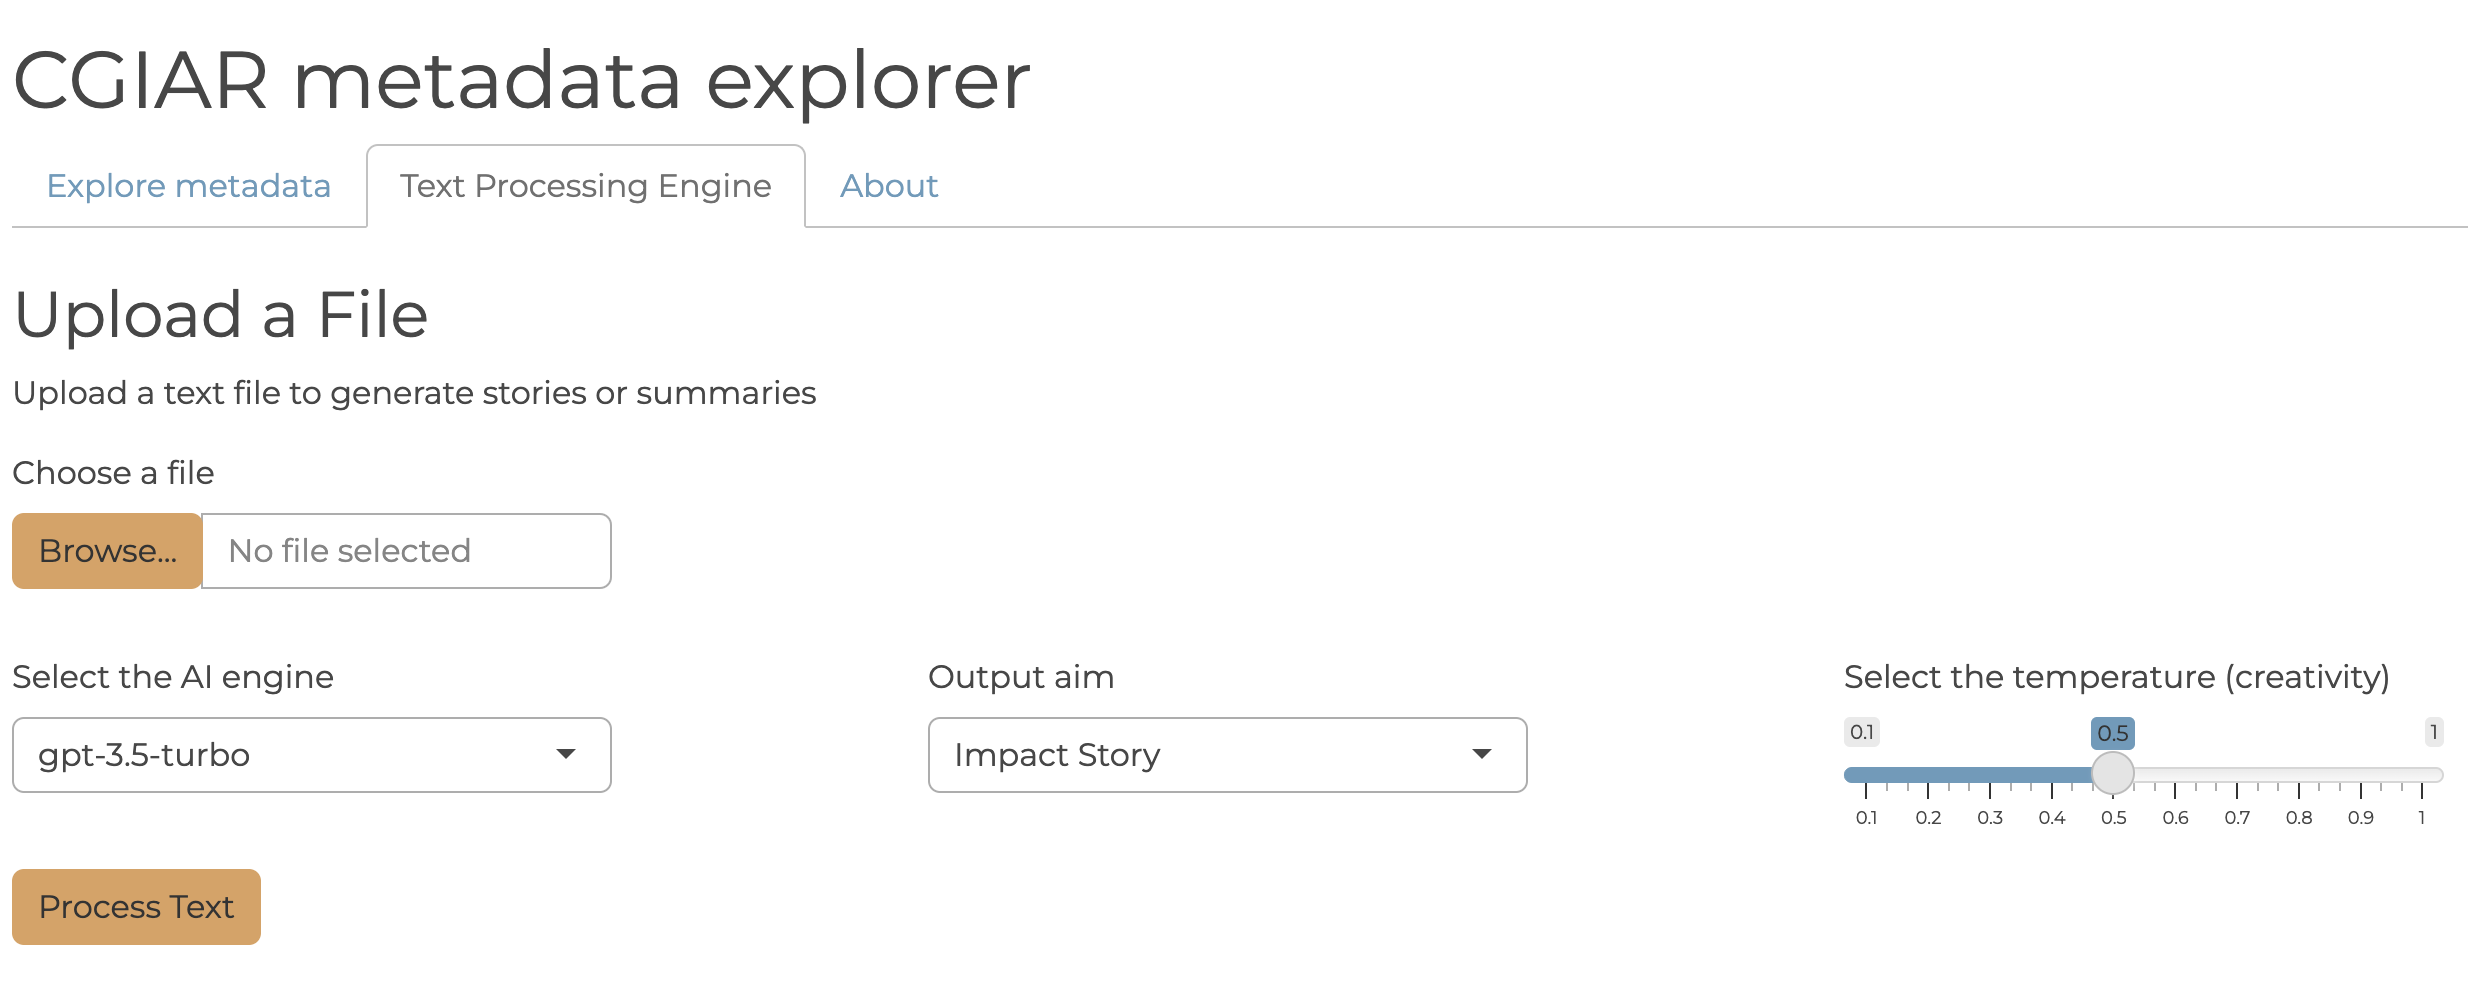
aquadata.data.mapping uses metadata information to download data and use a Shiny interface to elaborate data summaries, evidence-based stories and scientific reports’ summaries using AI tools, as OpenAI engines GPT-4 and GPT-3.5. It also provides an interface to upload text files to be processed by AI tools

This repository is part of work package 1 “AquaData” of the initiative “Resilient Aquatic Food Systems for Healthy People and Planet” (https://cgspace.cgiar.org/handle/10568/121141 ).
Further info:
https://www.cgiar.org/initiative/15-resilient-aquatic-foods-for-healthy-people-and-planet/
To get started
Install and load the R package from the most recent version using the following commands on the R console:
# install.packages("devtools")
# devtools::install_github("WorldFishCenter/aquadata.data.mapping")
library(aquadata.data.mapping)
Explore the data
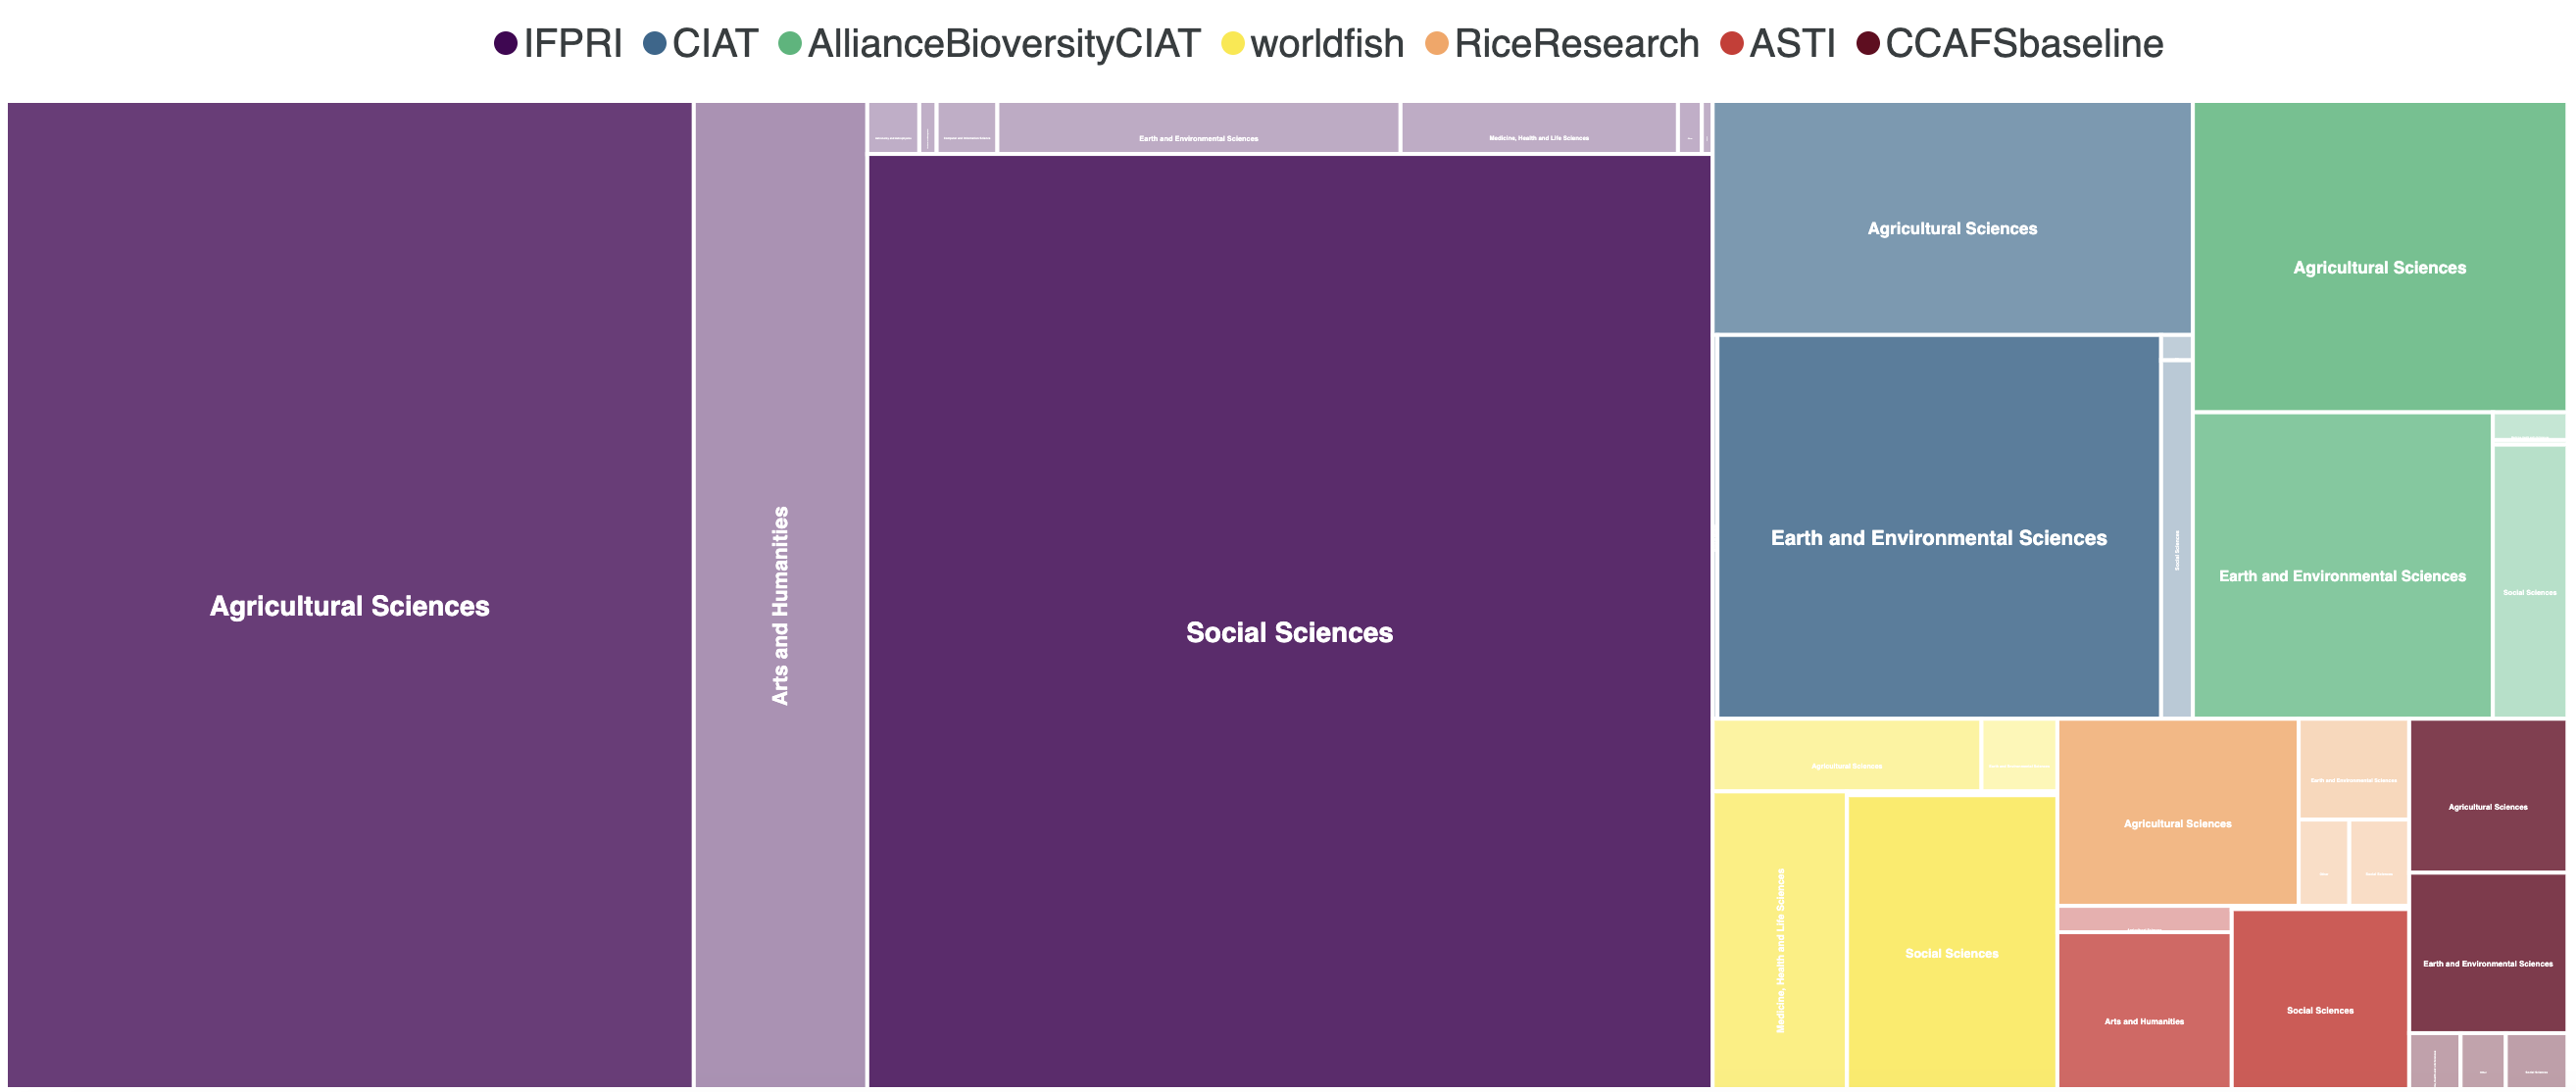
Once installed, you can access and explore the data directly from the package. dataverse_metadata include metadata information on the data of several CGIAR organizations.
# Summary of dataverse_metadata
dplyr::glimpse(dataverse_metadata)
#> Rows: 22,447
#> Columns: 9
#> $ organization           <chr> "AllianceBioversityCIAT", "AllianceBioversityCI…
#> $ dataset_id             <int> 3248318, 3248318, 3248318, 3248318, 3248318, 32…
#> $ dataset_doi            <chr> "doi:10.7910/DVN/DAYUIL", "doi:10.7910/DVN/DAYU…
#> $ publication_date       <date> 2021-03-11, 2021-03-11, 2021-03-11, 2021-03-11…
#> $ title                  <chr> "environmental awareness and attitudes among st…
#> $ subject                <chr> "Agricultural Sciences", "Earth and Environment…
#> $ keyword_value          <chr> "climate change", "climate change", "climate ch…
#> $ keyword_vocabulary     <chr> "AGROVOC", "AGROVOC", "AGROVOC", "AGROVOC", "AG…
#> $ keyword_vocabulary_uri <chr> "http://aims.fao.org/aos/agrovoc/c_1666", "http…

# CGIAR organizations
unique(dataverse_metadata$organization)
#> [1] "AllianceBioversityCIAT" "ASTI"                   "CCAFSbaseline"
#> [4] "CIAT"                   "IFPRI"                  "RiceResearch"
#> [7] "worldfish"
You can filter the data using the filterby_word function and show the first 10 rows:
filtered_metadata <- filterby_word(word = "Bangladesh")
head(filtered_metadata)
#> # A tibble: 6 × 9
#>   organization dataset_id dataset_doi            publication_date title  subject
#>   <chr>             <int> <chr>                  <date>           <chr>  <chr>
#> 1 ASTI            2693658 doi:10.7910/DVN/ZMP4MZ 2015-11-03       asti … Arts a…
#> 2 ASTI            2693658 doi:10.7910/DVN/ZMP4MZ 2015-11-03       asti … Social…
#> 3 ASTI            2693658 doi:10.7910/DVN/ZMP4MZ 2015-11-03       asti … Arts a…
#> 4 ASTI            2693658 doi:10.7910/DVN/ZMP4MZ 2015-11-03       asti … Social…
#> 5 ASTI            2693658 doi:10.7910/DVN/ZMP4MZ 2015-11-03       asti … Arts a…
#> 6 ASTI            2693658 doi:10.7910/DVN/ZMP4MZ 2015-11-03       asti … Social…
#> # ℹ 3 more variables: keyword_value <chr>, keyword_vocabulary <chr>,
#> # keyword_vocabulary_uri <chr>Generate stories using AI
Use AI tools (ChatGPT) to generate stories from downloaded data.
# output <-
#  chatgpt_wrapper(
#    document_path = "inst/docs_dataverse/5636634.txt",
#    openaikey = OPENAI_TOKEN,
#    engine = "gpt-3.5-turbo",
#    temperature = 0.7,
#    refine_text = REFINE_TEXT
#  )
# cat(output$output_text)